SmartGuard - or Predictive Low Glucose Management (PLGM) - is the key reason we went for
the 640g. Of course, the system is only as good as the weakest component and
for PLGM on the 640g that’s definitely the Enhanced Enlites. Whilst we’ve been
relatively lucky with our performance, others have not been. Common themes have
emerged, such as impaired accuracy in the first 24 hours. I tried to tease
apart the Enlite algorithm (see here, here and here...) if you’re interested.
But for this post, I thought I’d try to step through how
SmartGuard works – or rather some of the algorithms and methods that might have been employed to come up with the apparent implementation.
Usual rules apply – this is my best guess i.e. it might be wrong.
Please contact me via the comments below or via Facebook to let me know where
I’ve gone wrong.
What is SmartGuard (PLGM)?
PLGM has one key aim: to avoid as many hypoglycaemic events as
possible, whilst not triggering excessive hyperglycaemic rebounds after each
intervention.
It has one weapon to deploy: suspend basal delivery in advance of
a predicted hypo event and resume it as soon as it’s safe to do so.
It’s binary and fixed – there are no options, to drop to, say, a 50%
basal or tweak the resume criteria.
Sounds straightforward. Indeed, a very crude look at our first month of SmartGuard experience demonstrated that there was some correlation (but far from perfect)
between a basic slope – rate of change of Sensor Glucose (SG) – and triggering
of PLGM, whereas resume settings appeared more complicated than just looking for a
trigger level of SG or positive climb in SG away from a hypo or near-miss. Of course, what I'd missed at the time was the Predicted SG value (tucked in the CSV file) - more on that later.
SmartGuard Basics
Mike over at Everyday Ups and Downs has put together a brilliant animation showing the key information on how - officially - SmartGuard works. It's pretty straightforward:
- Set a SmartGuard Low Level (we have ours set to 4.0 mmol/l, or ~72 mg/dl)
- SmartGuard ignores all SG shenanigans when SG is above this level + 3.9 mmol/l (+ ~70 mg/dl)
- It calculates a predicted SG value - this is what it thinks you'll be at in 30 minutes time based on recent SG values [more later]
- If this predicted SG value is less than your lower level + 1.1 mmol/l (i.e. 5.1 mmol/l for us) it triggers and basal delivery is suspended
- For resuming basal, SmartGuard looks for a predicted SG value of your lower level + 2.2mmol/l (+ ~40 mg/dl). Current SG must be at least 1.1 mmol/l above your low limit and SmartGuard must have been running for at least 30 minutes.
Simples...
At this point, you may decide to pack your bags and go home (or press the back button) as you now know - as far as I can tell - how SmartGuard on the 640g is implemented.
Except:
- where did those values come from?
- and how does the pump calculate 30 minutes out in advance?
A Quick Summary...
For those who don’t like scrolling, here’s the summary, but please
carry on for the full story if you’re interested :-)

Triggering SmartGuard suspend and resume events can be successfully modelled by:-
- Generating a cost function, based on tracking both the "mean" and the "variation" in log-transformed SG data.
- At each SG event, SG data from T0, T-5, T-10 minutes and a predicted SG value are used in the function.
- It appears to use the patient's target glucose value (e.g. 135 mg/dl for Janki at the mo), but a generic value of ~135 mg/dl (7.5 mmol/l) might be ok (I don't have enough data).
- The cost function threshold (risk) for suspend before low / resuming basal appears to be the same.
- It keeps tabs on SG errors, maintaining current status if SG errors are flagged internally, as you'd expect.
- It doesn't appear to use Insulin-on-Board (IOB), confirming what's implied by the simple multiple SG threshold values quoted above.
And now for the detail :-o Sorry this is a long one - I hope you find it interesting.
What do we need? - A Panic Function
But if you're coming down from a high SG (way above target) and falling rapidly, your emotions will be very different, relieved to see insulin kicking in. Unlikely to be hypo soon.
Then there's the half-way house: you could have a SG that's just chugging along, a bit below target, but not looking like a hypo is coming soon. You might think to take a look in a little while, in case the fickle diabetes "weather" is about to turn, but there's no immediate concern.
Before we dive in, a quick sanity check - can you just use the slope of the recent (say last 5 or 10 minutes) SG data to predict a low? Although it looks like you might be able to from Mike's lovely generalised animation, the reality is, unfortunately, not so kind:

The graph above uses the current SG value and two previous values (-5 and -10 minutes). It does trigger for the hypos and near misses on this day, but it's triggering on a lot of other occasions as well. More like an egg timer than a hypo alarm... ;-)
The Input – Sensor Glucose

At first glance, SG data looks a mess (stare at it too long and you
start to wonder how anyone with T1D copes, physically and emotionally, with
this kind of variation...)
But is there a pattern, a structure here? Squashing this data down
into a histogram (showing you how often SG has been in a given range),
demonstrates that we have values that are more common than others (hopefully
around your target glucose level J ).

From this, we could try to extract parameters to describe the
distribution. The common ones that most people will be familiar with are
measures of what's known as central tendency (think of mean, median and mode back in school) and
dispersion (think of range, variance or standard deviation).
The most common central tendency measurement would be the mean
(actually short for the arithmetic mean): simply add all of the measurements up
and divide by the number of measurements.
Likewise, for dispersion, (arithmetic) standard deviation is often
calculated. This is given by the square root of the sum of the squared
differences of each value from the (arithmetic) mean, divided by the number of
measurements [if our data is only a subset, a sample of all of the data – and
it will be... – we actually need to divide by the number of measured events
minus one].
Presumption #1: Take the Log
Whilst some sort of fit of these parameters can be made, the fit
is not great... It’s clearly non-normal (skewed) data (i.e. it doesn’t look
like a bell-shaped curve). What has been known for a long time, is that many
biological processes “fit” to the logarithmic transform of their data. This is
also a technique that Medtronic have employed in their simulation models of
continuous glucose monitoring (see abstract 2330-PO here for example).

We now have a bunch of glucose data-points that resemble a Normal
distribution. The significance of this is that this log-normal distribution can now be described by just two parameters:
- Geometric Mean
- Geometric Standard Deviation
Geometric Mean = mean /
SQRT(1+sd2/mean2)
Geometric standard Deviation = exp(SQRT(1+ sd2/mean2))
Presumption #2: Recent Data
– and the Crystal Ball
Tracking what’s happened during the past 24 hours or so is
interesting, but pretty useless in terms of predicting exactly when a hypo is
coming along. Clearly, only data in the immediate past is going to contribute
to predicting a hypo. The more data points you use, the more likely a sudden
change will be masked in your metric, but use too few and noise in this data may confound your prediction of where SG is heading... Therefore, it seems reasonable assume
that the current (t=0) SG value and the immediate one or two events (usually
t=-5 and t=-10 minutes) should be included.
The 640g also generates a “Predicted SG” value (it’s buried in the
CSV output file from CareLink). This looks like the pump’s best estimate of where SG will be in 30 minutes time (i.e. the PLGM horizon).
We know this is the value that the pump uses in the SG-threshold based algorithm (and this is confirmed in the data in section #4).
I don't know exactly how the Medtronic predicted SG value is calculated. But it’s probable that it's generated using
something along the lines of Nightscout’s prediction algorithm. Nightscout uses a beautifully simple log-transformed (spotting a pattern here..? ;-) ) second-order auto-regressive function to predict up
to 30 minutes ahead on its display (and to set predictive alarms):

Although, not a perfect match, the Medtronic and NightScout Predicted SG values are usually very close and both do a good job of crystal ball gazing half an hour into the future. The Nightscout algorithm forces a mean glucose value of 140 mg/dl (~7.8 mmol/l) throughout the calculation (log(SG/mean) at the two time points).
It's worth mentioning that this predicted value - or rather a predicted range of values, within which Nightscout is 95% confident future SG values will fall - is shown on the Nightscout display (the cyan dots on the right):
So that's all our data extracted and calculated - we can generate a mean and
deviation values, which describe the local SG picture.

Although, not a perfect match, the Medtronic and NightScout Predicted SG values are usually very close and both do a good job of crystal ball gazing half an hour into the future. The Nightscout algorithm forces a mean glucose value of 140 mg/dl (~7.8 mmol/l) throughout the calculation (log(SG/mean) at the two time points).
It's worth mentioning that this predicted value - or rather a predicted range of values, within which Nightscout is 95% confident future SG values will fall - is shown on the Nightscout display (the cyan dots on the right):
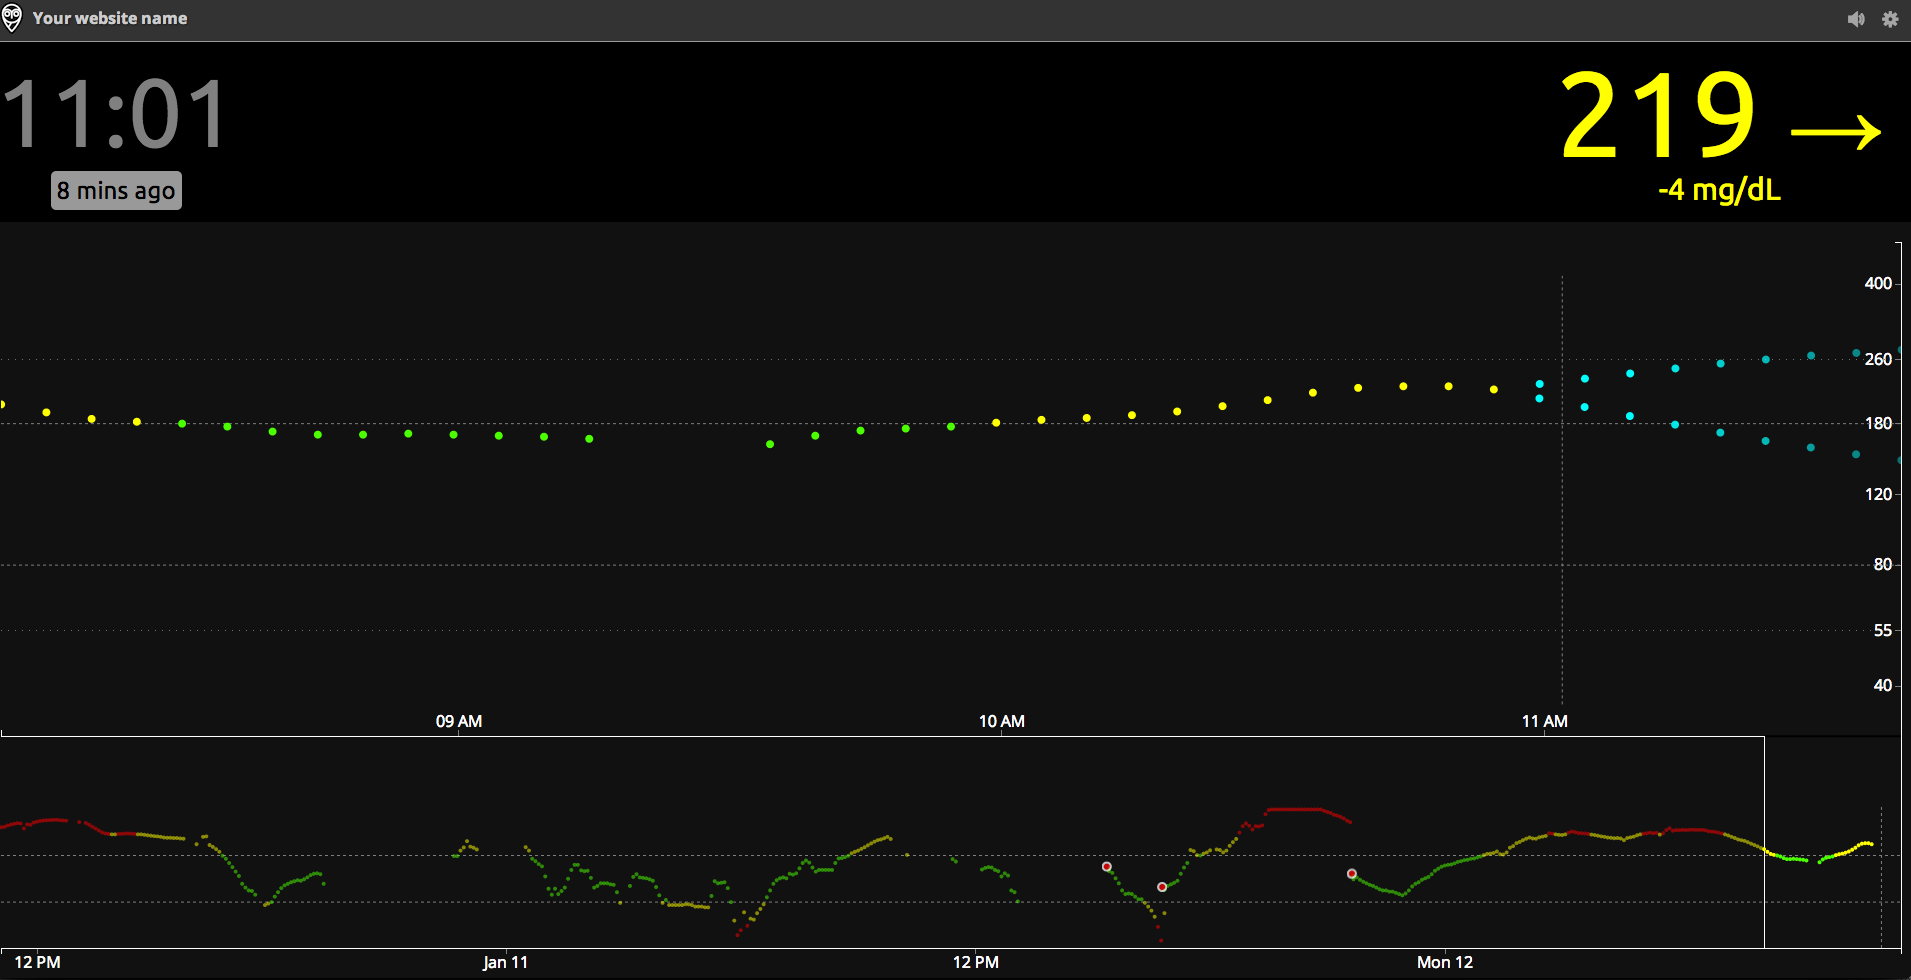 |
| Nightscout Web Display |
Predicted SG isn't shown on the 640g - it would be nice to see the pump's bright and colourful display put to better use and to include the future trend lines, seeing as it's done the calc already... Just saying...
Presumption #3: There’s a
Cost to Everything: The Risk (or Loss) Function
Now that we have values for local data characterisation, how could
we go about using these to prompt a suspend before low or resume event?
In machine decision theory, we need to form a cost (or loss)
function that takes these values and assigns a score (or cost, or loss)
associated with them. Before diving in, let’s think again about those scenarios we first mentioned up near the top of the blog, but now thinking about the "shape" of the recent data:
- High SG, falling fast - not of immediate concern; we’re above the target BG
- Mean SG will be high
- SD will be high (rapid change)
- Cost function should be low - medium
- Low SG, steady - not of immediate concern; we’re chugging along, a bit below target, but not looking like a hypo is coming anytime soon
- Mean SG will be low
- SD will be low (steady SG readings)
- Cost function should be medium
- Low SG, falling
- Getting worried; we might be heading for a hypo...
- Mean SG will be low
- SD will be high (rapid change)
- Cost function should be high
First, in terms of glycaemic control, with our log-normal distribution,
our cost (or loss) function needs to increase rapidly as we move away from our
target value:
Cost(G) = (log(G) – log(Gtarget))2
For the local data we are considering, we have :
Cost(G) = (log(GGM Mean) – log(Gtarget))2 for values below the mean or target glucose level (when we're above, we'll set the cost to zero).
But that only represents part of the cost, or loss – it does not
reflect the dispersion in the data sample and it's clear from the examples above that we'll need both to reflect the total Cost (i.e. to get an equivalent score that mimics how stressed you're feeling about the risk of a hypo). This can be expressed as the
Geometric Variance.
Combining the two, we have:
Total Cost(G) =
log(Geometric SD)2 + (log(GGM Mean) – log(Gtarget))2
A predetermined trigger level (i.e. level of acceptable risk)
could be set in the pump for suspending basal. Let’s assume the resume trigger level is set at the
same point.
Presumption #4: Mind the
Gaps...
We know that sometimes the Enlites throw in the towel and
you get a data error and, er, no (or delayed) data. Let’s assume that the algorithm is
clever enough to avoid using these data drops and will maintain its current
status (i.e. in suspend or not) during any error states.
Let’s also assume that thought was given to include
Insulin-On-Board (IOB) as an additional Cost (risk) function. As parents, we
certainly know the feeling of seeing 3 units on-board, 5.something mmol/l and
three arrows down and thinking “Where have all the carbs gone!!!”). But including
IOB is complex: it could theoretically be used to add weight to a falling SG,
but then we’d need to capture more information about the local data (other than
geometric distribution and mean). Therefore, I’ve decided not to include it in
my current model.
So does the total cost function work?
Yes.
Using the four presumptions above, I get very good
correlation with the SmartGuard (PLGM) triggers and resumes with Janki's data. Note that the model is not triggering on a predefined SG value, but rather on the level of cost, or risk of a hypo, that it's calculation.
In these graphs, the orange crosses are where we've resumed manually; no cross, means automatic basal resumption:
In these graphs, the orange crosses are where we've resumed manually; no cross, means automatic basal resumption:
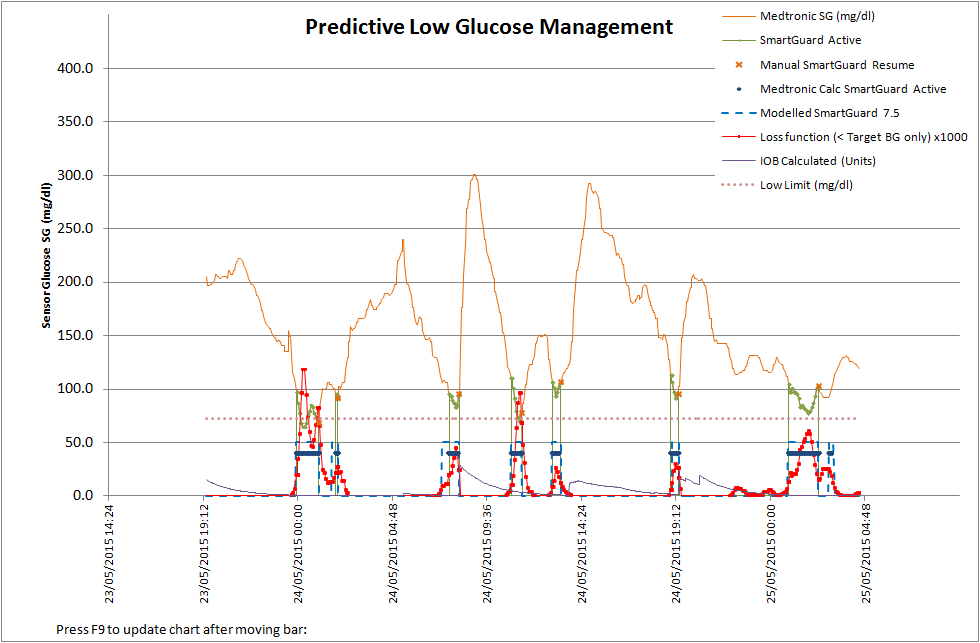

- The solid blue line is a confirmation of the trigger level algorithm matching when SmartGuard is active (the green line) i.e.as per Mike's animation
- The red curve is the cost function we've derived here, that's a measure of risk - and how anxious as a parent or patient you'll be feeling.
- The dotted-blue box is the model output, as controlled by the cost function i.e. PLGM suspension triggered or basal resumed.
What’s even more encouraging, is that it also seems to work well
on another patient – when their Enlites were working...
Conclusions
I can’t say this is definitely the cost function model that was used to generate the thresholds used on SmartGuard on
the 640g. But using the fairly basic assumptions here, I have been able to
reliably mimic the trigger and automatic resume events we’ve encountered in the vast majority of cases.
It’s nice to see a relatively straight-forward model provide the
foundations for a very powerful tool and one that we will use over and over again during the time Janki has her 640g.
Hats off to the PLGM development team at Medtronic – it’s a wonderful addition
in helping us achieve Little D.
No comments:
Post a Comment